Practical, Self-service Marketing Analytics, Part 2: The Transformation in Action
We did it! We ate our own dogfood. We moved from multiple marketing dashboards with disparate data sources to a single consolidated, visual dashboard that the whole team can utilize. From website sessions to social media, demand generation emails, and Google ad campaigns - we’ve accessed, filtered, formatted, and presented our data.
This transformation to self-service marketing analytics has allowed our marketing team to confirm our intuition-based assumptions, discover new insights, and effectively improve our marketing programs. We’re now empowered with data for our marketing campaign decisions, thanks to Monarch and Watson Analytics. Want to know how we did it? Below are some key steps to follow to ensure you’re getting the most out of your marketing data.
We found that one of the most time-consuming processes when trying to analyze overall marketing performance is accessing the data from multiple reporting systems, including your CRM, Google Analytics, social media channels, and demand generation tools. These reports can come in different file types and structures, making combining the data very tedious. Using Monarch, we sped up the data collection process by connecting our tools, specifically Salesforce and Google Analytics, directly into Monarch. This way, updated reports would be pulled in automatically to our workspace, eliminating hours of manual data preparation. For other reports, we utilized the ability to edit file paths to update reports, allowing us to guarantee data quality in our final dashboards.
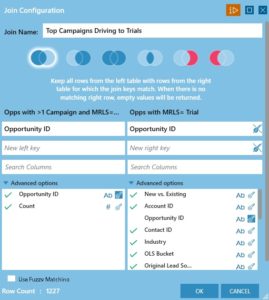
Joining data sets
After creating an easy, repeatable process for accessing the reports, the next step was transforming the spreadsheets for visualization. Again, efficiency and ease of use were key when completing this process. Using Monarch, any marketing analyst can build repeatable transformation processes without coding. It was as simple as dragging and dropping the files and format changes once, so all future dashboard updates can be automatic. This way, we could spend our time analyzing the data, not just organizing it.
Have you ever been asked by your manager, “Where did you get this metric? What time frame did you look at? Did you include or exclude this specific campaign from your analysis?” If you have, then you know the importance of being able to look back at your original data sheets and see the changes you made to the information. Tracking changes is key to successful marketing analytics, because it ensures data quality, and gives management confidence in the KPIs you’ve shown. Monarch allowed us to export our Change List, so the whole team could be confident in the data. It saved hours of effort that would have been used to manually record all filters, transformations, and processes. Utilizing Monarch, our team could focus on the results and insights, and let the tool handle the documentation.
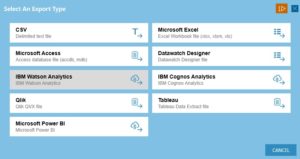
Export to Watson
After finalizing the data preparation for our data sources, the next step was exporting the data into a format that could be used for the team’s dashboard. We wanted our dashboard to be easy to navigate and provide clear insights into our KPIs. We used IBM Watson Analytics to visualize our data, and found the simple 3-click export from Monarch to be crucial. By using the Watson and Monarch integration, we could again ensure high-data quality, and focus our effort on building our ideal visualizations. Using Watson’s question recognition and easy drag and drop tools, we built colorful, dynamic dashboards in hours. We can now highlight key metrics, make annotations, and easily share findings with team members.
The ability to gain quick insights, share with the team, and make actionable, informed decisions based on the data has changed the way our team performs. We can now be confident that our marketing efforts can be measured, our hypotheses are backed up by data, and our efforts across all channels are aligned. As we continue this marketing transformation journey, we plan to add other data sources to our dashboard, to further enrich our insights into our customer base. We hope you’ll join us on this adventure by examining your own processes and discovering how self-service data preparation could revolutionize your business.