The Science and the Art of Data-driven Processes
The business decision-making process starts with raw data, which is then analyzed and interpreted as it turns into information. This, in turn, drives effective business outcomes as the information leads to insight and knowledge. Think of the data pipeline process as the central nervous system for decision-making, supported by self-service data preparation technology.
There are many full-time roles dedicated to data pipeline operations such as the business analyst, data engineer, and business intelligence specialist, to name a few, but a great variety of functional roles outside of these full-time activities also require working with the data pipeline efficiently and on regular basis.
While the data process owners in most organizations are not trained as data scientists, they do tend to face many of the same challenges and typically follow similar data pipeline activities, despite dealing with less technical and less mathematically intensive requirements. And although we tend to focus on the typical business analyst, there is an overlap with data science that is both interesting and compelling. When I spoke with Gartner’s business intelligence and analytics market researcher, Daniel Harris, he agreed. “Indeed, given the rarity of highly skilled data scientists, Gartner has advanced the concept of the “citizen data scientist” – i.e., business analysts and other line-of-business users of data science technologies and methods rather than standard business intelligence platforms. As more and more business analysts take the plunge into sophisticated techniques based on machine-learning and data mining, the need for self-service data preparation solutions that allow analysts to bypass traditional ETL processes will increase significantly.”
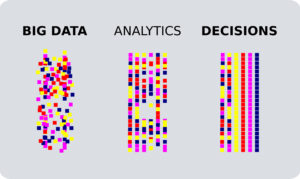
In the data science community, there is a commonly held premise which maintains that anything you can teach a machine to do with data is science, and the rest is art. As such, it can be argued that self-service data preparation for any organization must support both the science and the art of working in a data-driven process, which is almost always iterative in nature and typically has three phases:
- Efficiently acquire raw data
- Perform exploratory and interpretive analysis
- Summarize, aggregate and draw conclusions
There are two primary kinds of data that an analyst will encounter: transactional data and master data. Transactional data represents “events”, and master data represents “things” that provide context for the events. For example, an “event” can be a transaction or purchase, and the “things” that describe this event can include many descriptors like the time of purchase, the buyer’s name, the products purchased, and so on. This seems simple enough, however in reality can be highly complex due to the great variation of data sources and operations on the data that is often required to properly understand and report on events. The rigor, discipline and level of completeness employed during each of these phases will determine the value of everything else that comes afterwards like reports, charts, forecasts, predictions, prescriptions, and even to feed machine learning algorithms.
“Whereas analysts running queries against traditional data warehouses can depend to a large extent on normalized “descriptors” across the organization,” Harris adds, “what happens if you need to mashup some kind of external data source with data in the warehouse? Even if you’ve gone to the trouble of standardizing on a data model, this work goes out the window once you bring in a new set of descriptors, or unstructured data to which descriptors haven’t yet been assigned. At this point, a self-service tool will become necessary to supplement existing ETL processes.”
Self-service data preparation solutions are designed specifically to support both the “science” of these activities, as well as the “art” necessary for proper data orchestration and to efficiently glean insight. Data preparation solutions must not only maximize the efficiency and throughput of these processes, but also provide key intangible values for the data analyst such as the ability to quickly and easily understand and validate the data flows and processes at any step in the cycle, and easily re-run the processes in whole or in part as may be required.
The judgments we pass on the data as it is converted into information are essential during the data preparation phase. These activities require tools that empower the data process owner to explore, summarize, enrich and reconstitute the information in many different ways and from multiple contextual perspectives.
These activities also require that the data be properly vetted out and curated. The examples below illustrate common pitfalls to watch for in working with the data pipeline:
- Noisy data – the system should provide the ability to find and filter out the noise in the data. This could be outliers that are one-off events, or dense data that the inclusion of which would lead to an incorrect analysis. For example, there could be a period of high volume and high margin sales transactions generated when a key competitor was experiencing an extended strike in an industry that would normally have stable labor relationships.
- Missing data – the system should facilitate finding and resolving situations when data is simply not consistently available, missing the proper context or perhaps lacking in proper periodicity or granularity. For example, unidentified null values in a data set can easily lead to misleading counts, resulting in inaccurate summarizations and conclusions. “In my research on self-service solutions,” says Harris, “Altair Monarch impressed me as a particularly robust solution for this purpose, with capabilities such as join analysis and fuzzy match scoring. Increasingly, analysts can rely on the algorithmic intelligence of their tools in assessing data quality, instead of bringing in advanced techniques from statistics.”
- Errors in the data – the system should facilitate finding and cleansing data that is simply wrong, such as incorrectly typed raw data or data from one reporting period that has been reported in a different period. A good example of this is data that is marked with a volume factor, like M, B or K for millions, billions and thousands, but the factors are incorrectly typed. (Interestingly, a publicly available data set on United States storm data has a similar error in the raw data so using that data unadjusted could possibly lead to inaccurate social policy decisions when assigning risk profiles to different types of storm events.)
Potential problems and issues like these must be discovered, accounted for and resolved in order to effectively use data for all the downstream activities that depend on a solid yet adaptable and flexible data preparation foundation. The above examples would require that the data process owner perform an in-depth review and very likely exclude, modify, enrich and possibly even replace the raw data before the data can be properly used for downstream analysis.
It is also necessary to make adjustments and refinements as more insight is acquired during these iterative data due diligence activities. In fact, even the raw data must often be modified, such as inferring missing values or deciding where the raw data is simply insufficient to proceed further and therefore trigger further data acquisition activities.
The term “data shaping” is often used in connection with data preparation and it refers to performing activities necessary for visualization tools to consume and interpret the data. However, data shaping is only a subset of data preparation as there are typically many other data preparation activities that take place before the actual data shaping phase can begin.
A final observation regarding data preparation technology is that it should empower the users without placing undue technical burdens and complexities on them or their organizations. For example, the typical business user should not be required to learn advanced SQL syntax, or immerse themselves in the complexity of cardinality in order to easily and efficiently join multiple data sets. The users should also be able to build multiple data perspectives from source data as well, and not require that the IT organization build and maintain custom views every time a user needs a sub-set of data from a main data store. Once a data process is modeled, it should then be simple for the analyst to save the model definitions and re-run on demand or on a schedule with simple controls to manage the required automation activities.